| client | ||
| common | ||
| doc | ||
| imgui | ||
| nfd | ||
| server | ||
| standalone | ||
| test | ||
| .gitignore | ||
| AUTHORS | ||
| LICENSE | ||
| README.md | ||
| TracyClient.cpp | ||
Tracy Profiler
Tracy is a frame profiler that can be used for remote or embedded telemetry of your application.
Tracy requires compiler support for C++14 and Thread Local Storage. There are no other requirements. The following platforms are confirmed to be working:
- Windows (x64)
- Linux (x64, ARM64)
- Android (ARM)
Other platforms should also work fine.
High-level overview

Tracy is split into client and server side. The client side collects events using a high-efficiency queue and awaits for an incoming connection. The server part connects to client and receives collected data from the client, which is then reconstructed into a viewable timeline. The transfer is performed using a TCP connection.
Performance impact
To check how much slowdown is introduced by using tracy, I have profiled etcpak, which is the fastest ETC texture compression utility there is. I used an 8192×8192 test image as input data and instrumented everything down to the 4×4 pixel block compression function (that's a lot of blocks to compress). There are two scenarios that were tested:
- Compression of an image to ETC1 format.
- Compression of an image to ETC2 format, with mip-maps.
It should be noted that tracy needs to calibrate its internal timers at each run. This introduces a delay of 115 ms (on my machine), which is negligible when doing lengthy profiling runs, but it skews the results of etcpak timing. The following times have this delay subtracted, to give focus on zone collection impact, which is the thing that really matters here.
| Scenario | Zones | Clean run | Profiling run | Difference |
|---|---|---|---|---|
| 1 | 4194568 | 0.94 s | 1.003 s | +0.063 s |
| 2 | 5592822 | 1.034 s | 1.119 s | +0.085 s |
Usage instructions
Initial client setup
Copy files from tracy/client and tracy/common to your project. Add tracy/TracyClient.cpp to source files list. That's all. Tracy is now integrated into your application.
Marking zones
To begin data collection, tracy requires that you manually instrument your application (automatic tracing of every entered function is not feasible due to the amount of data that would generate). All the user-facing interface is contained in the tracy/client/Tracy.hpp header file.
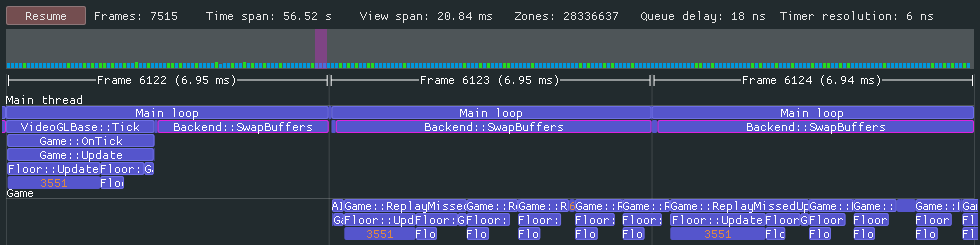
To slice the program's execution recording into frame-sized chunks, put the FrameMark macro after you have completed rendering the frame. Ideally that would be right after the swap buffers command. Note that this step is optional, as some applications (for example: a compression utility) do not have the concept of a frame.
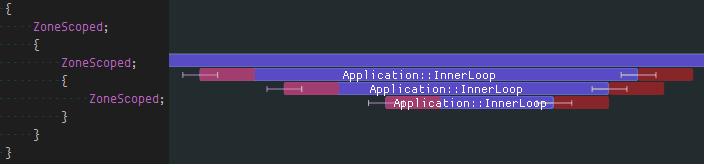
To record a zone's execution time add the ZoneScoped macro at the beginning of the scope you want to measure. This will automatically record function name, source file name and location. Optionally you may use the ZoneScopedC( 0xBBGGRR ) macro to set a custom color for the zone. Note that the color value will be constant in the recording (don't try to parametrize it). After you have marked the zone, you may further parametrize it.
Use the ZoneName( const char* name ) macro to set a custom name for the zone, which will be displayed instead of the function's name in the timeline view. The indented usage is to provide a string literal. (The text string that you provide must be accessible indefinitely at the given address. Tracy does not guarantee at which point in time it will be sent to the server and there is no notification when it happens.)
Use the ZoneText( const char* text, size_t size ) macro to add a custom text string that will be displayed along the zone information (for example, name of the file you are opening). Note that every time ZoneText is invoked, a memory allocation is performed to store an internal copy of the data. The provided string is not used by tracy after ZoneText returns.
Marking locks
Tracy can collect and display lock interactions in threads.

To mark a lock (mutex) for event reporting, use the TracyLockable( type, varname ) macro. Note that the lock must implement a Lockable concept (i.e. there's no support for timed mutices). For a concrete example, you would replace the line std::mutex m_lock with TracyLockable( std::mutex, m_lock ). You may use TracyLockableN( type, varname, description ) to provide a custom lock name.
The standard std::lock_guard and std::unique_lock wrappers should use the LockableBase( type ) macro for their template parameter (unless you're using C++17, with improved template argument deduction). For example, std::lock_guard<LockableBase( std::mutex )> lock( m_lock ).
To mark the location of lock being held, use the LockMark( varname ) macro, after you have obtained the lock. Note that the varname must be a lock variable (a reference is also valid). This step is optional.
Running the server
The easiest way to get going is to build the standalone server, available in the standalone directory. You can connect to localhost or remote clients and view the collected data right away.
Alternatively, you may want to embed the server in your application, the same which is running the client part of tracy. Doing so requires that you also include the server and imgui directories. Include the tracy/server/TracyView.hpp header file, create an instance of the tracy::View class and call its Draw() method every frame. Unfortunately, there's also the hard part - you need to integrate the imgui library into the innards of your program. How to do so is outside the scope of this document.
Good practices
- Remember to set thread names for proper identification of threads. You may use the functions exposed in the
tracy/common/TracySystem.hppheader to do so. Note that the max thread name length in pthreads is limited to 15 characters. Proper thread naming support is available in MSVC only if you are using Windows SDK 10.0.15063 or newer (a tracy-specific workaround may be added in the future). - Enable the MSVC String Pooling option (
/GF) or the gcc counterpart,-fmerge-constants. This will reduce number of queries the server needs to perform to the client. Note that these options are enabled in optimized builds by default.
Practical considerations
Tracy's time measurement precision is not infinite. It's only as good as the system-provided timers are.
- On the embedded ARM-based systems you can expect to have something around 1 µs time resolution.
- On x86 the time resolution depends on the hardware implementation of the RDTSCP instruction and typically is in the low nanoseconds. This may vary from one micro-architecture to another and requires a fairly modern (Sandy Bridge) processor for reliable results.
While the data collection is very lightweight, it is not completely free. Each recorded zone event has a cost, which tracy tries to calculate and display on the timeline view, as a red zone. Note that this is an approximation of the real cost, which ignores many important factors. For example, you can't determine the impact of cache effects. The CPU frequency may be reduced in some situations, which will increase the recorded time, but the displayed profiler cost will not compensate for that.