| capture | ||
| client | ||
| common | ||
| doc | ||
| imgui | ||
| nfd | ||
| server | ||
| standalone | ||
| test | ||
| .gitignore | ||
| AUTHORS | ||
| FAQ.md | ||
| LICENSE | ||
| NEWS | ||
| README.md | ||
| Tracy.hpp | ||
| TracyClient.cpp | ||
| TracyLua.hpp | ||
| TracyOpenGL.hpp | ||
Tracy Profiler
Tracy is a real time, nanosecond resolution frame profiler that can be used for remote or embedded telemetry of your application. It can profile both CPU (C++, Lua) and GPU (OpenGL). It also can display locks held by threads and their interactions with each other.

Tracy requires compiler support for C++11, Thread Local Storage and a way to workaround static initialization order fiasco. There are no other requirements. The following platforms are confirmed to be working (this is not a complete list):
- Windows (x86, x64)
- Linux (x86, x64, ARM, ARM64)
- Android (ARM, x86)
- FreeBSD (x64)
- Cygwin (x64)
- WSL (x64)
- OSX (x64)
The following compilers are supported:
- MSVC
- gcc
- clang
Introduction to tracy
A quick FAQ.
List of changes.
High-level overview

Tracy is split into client and server side. The client side collects events using a high-efficiency queue and awaits for an incoming connection. The server part connects to client and receives collected data from the client, which is then reconstructed into a viewable timeline. The transfer is performed using a TCP connection.
Performance impact
To check how much slowdown is introduced by using tracy, I have profiled etcpak, which is the fastest ETC texture compression utility there is. I used an 8192×8192 test image as input data and instrumented everything down to the 4×4 pixel block compression function (that's 4 million blocks to compress). It should be noted that tracy needs to calibrate its internal timers at each run. This introduces a delay of 115 ms (on my machine), which is negligible when doing lengthy profiling runs, but it skews the results of etcpak timing. The following times have this delay subtracted, to give focus on zone collection impact, which is the thing that really matters here.
| Scenario | Zones | Clean run | Profiling run | Difference |
|---|---|---|---|---|
| Compression of an image to ETC1 format | 4194568 | 0.94 s | 1.003 s | +0.063 s |
| Compression of an image to ETC2 format, with mip-maps | 5592822 | 1.034 s | 1.119 s | +0.085 s |
In both scenarios the per-zone time cost is at ~15 ns. This is in line with the measured 8 ns single event collection time (each zone has to report start and end event).
Usage instructions
Initial client setup
Copy files from tracy/client and tracy/common to your project. Add tracy/TracyClient.cpp to source files list. That's all. Tracy is now integrated into your application.
In the default configuration tracy is disabled. To enable it, add a TRACY_ENABLE define.
If you want to profile a short-lived application, add a TRACY_NO_EXIT define. In this configuration tracy will not exit until an incoming connection is made, even if the application has already finished.
Marking zones
To begin data collection, tracy requires that you manually instrument your application (automatic tracing of every entered function is not feasible due to the amount of data that would generate). All the user-facing interface is contained in the tracy/Tracy.hpp header file.
To slice the program's execution recording into frame-sized chunks, put the FrameMark macro after you have completed rendering the frame. Ideally that would be right after the swap buffers command. Note that this step is optional, as some applications (for example: a compression utility) do not have the concept of a frame.
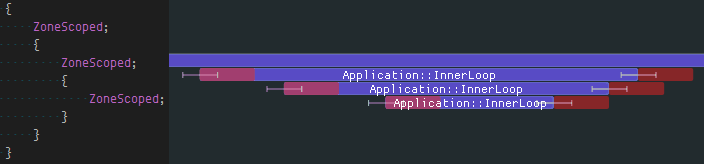
To record a zone's execution time add the ZoneScoped macro at the beginning of the scope you want to measure. This will automatically record function name, source file name and location. Optionally you may use the ZoneScopedC( 0xRRGGBB ) macro to set a custom color for the zone. Note that the color value will be constant in the recording (don't try to parametrize it). You may also set a custom name for the zone, using the ZoneScopedN( name ) macro, where name is a string literal. Color and name may be combined by using the ZoneScopedNC( name, color ) macro.
Use the ZoneText( const char* text, size_t size ) macro to add a custom text string that will be displayed along the zone information (for example, name of the file you are opening). Note that every time ZoneText is invoked, a memory allocation is performed to store an internal copy of the data. The provided string is not used by tracy after ZoneText returns.
Marking locks
Tracy can collect and display lock interactions in threads.

To mark a lock (mutex) for event reporting, use the TracyLockable( type, varname ) macro. Note that the lock must implement a Lockable concept (i.e. there's no support for timed mutices). For a concrete example, you would replace the line std::mutex m_lock with TracyLockable( std::mutex, m_lock ). You may use TracyLockableN( type, varname, description ) to provide a custom lock name.
The standard std::lock_guard and std::unique_lock wrappers should use the LockableBase( type ) macro for their template parameter (unless you're using C++17, with improved template argument deduction). For example, std::lock_guard<LockableBase( std::mutex )> lock( m_lock ).
To mark the location of lock being held, use the LockMark( varname ) macro, after you have obtained the lock. Note that the varname must be a lock variable (a reference is also valid). This step is optional.
Similarly, you can use TracySharedLockable, TracySharedLockableN and SharedLockableBase to mark locks implementing the SharedMutex concept. Note that while there's no support for timed mutices in tracy, both std::shared_mutex and std::shared_timed_mutex may be used.
Plotting data
Tracy is able to capture and draw value changes over time. You may use it to analyse memory usage, draw call count, etc. To report data, use the TracyPlot( name, value ) macro.

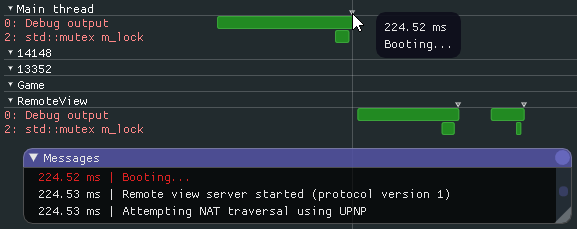
Message log
Fast navigation in large data set and correlation of zones with what was happening in application may be difficult. To ease these issues tracy provides a message log functionality. You can send messages (for example, your typical debug output) using the TracyMessage( text, size ) macro (tracy will allocate memory for message storage). Alternatively, use TracyMessageL( text ) for string literal messages. Messages are displayed on a chronological list and in the zone view.
Running the server
The easiest way to get going is to build the standalone server, available in the standalone directory. You can connect to localhost or remote clients and view the collected data right away.
If you prefer to inspect the data only after a trace has been performed, you may use the command line utility in the capture directory. It will save a data dump that may be later opened in the graphical viewer application.
Alternatively, you may want to embed the server in your application, the same which is running the client part of tracy. Doing so requires that you also include the server and imgui directories. Include the tracy/server/TracyView.hpp header file, create an instance of the tracy::View class and call its Draw() method every frame. Unfortunately, there's also the hard part - you need to integrate the imgui library into the innards of your program. How to do so is outside the scope of this document.
Lua support
To profile Lua code using tracy, include the tracy/TracyLua.hpp header file in your Lua wrapper and execute tracy::LuaRegister( lua_State* ) function to add instrumentation support. In your Lua code, add tracy.ZoneBegin() and tracy.ZoneEnd() calls to mark execution zones. Double check if you have included all return paths! Use tracy.ZoneBeginN( name ) to set zone name. Use tracy.ZoneText( text ) to set zone text. Use tracy.Message( text ) to send messages.
Even if tracy is disabled, you still have to pay the no-op function call cost. To prevent that you may want to use the tracy::LuaRemove( char* script ) function, which will replace instrumentation calls with whitespace. This function does nothing if profiler is enabled.
GPU profiling
Tracy provides bindings for profiling OpenGL execution time on GPU. To use it, you will need to include the tracy/TracyOpenGL.hpp header file and declare each of your rendering contexts using the TracyGpuContext macro (typically you will only have one context). Tracy expects no more than one context per thread and no context migration.
To mark a GPU zone use the TracyGpuZone( name ) macro, where name is a string literal name of the zone. Alternatively you may use TracyGpuZoneC( name, color ) to specify zone color.
You also need to periodically collect the GPU events using the TracyGpuCollect macro. A good place to do it is after swap buffers function call.
GPU profiling is not supported on OSX, iOS (because Apple is unable to implement standards properly). Android devices do work, if GPU drivers are not broken. Disjoint events are not currently handled, so some readings may be a bit spotty. NVIDIA drivers are unable to provide consistent timing results when two OpenGL contexts are used simultaneously.
Good practices
- Remember to set thread names for proper identification of threads. You may use the functions exposed in the
tracy/common/TracySystem.hppheader to do so. Note that the max thread name length in pthreads is limited to 15 characters. Proper thread naming support is available in MSVC only if you are using Windows SDK 10.0.15063 or newer. - Enable the MSVC String Pooling option (
/GF) or the gcc counterpart,-fmerge-constants. This will reduce number of queries the server needs to perform to the client. Note that these options are enabled in optimized builds by default.
Practical considerations
Tracy's time measurement precision is not infinite. It's only as good as the system-provided timers are.
- On the embedded ARM-based systems you can expect to have 1 µs time resolution. Some hardware is able to provide tens to hundreds nanoseconds resolution.
- On x86 the time resolution depends on the hardware implementation of the RDTSCP instruction and typically is a couple of nanoseconds. This may vary from one micro-architecture to another and requires a fairly modern (Sandy Bridge) processor for reliable results.
While the data collection is very lightweight, it is not completely free. Each recorded zone event has a cost, which tracy tries to calculate and display on the timeline view, as a red zone. Note that this is an approximation of the real cost, which ignores many important factors. For example, you can't determine the impact of cache effects. The CPU frequency may be reduced in some situations, which will increase the recorded time, but the displayed profiler cost will not compensate for that.
Lua instrumentation needs to perform additional work (including memory allocation) to store source location. This approximately doubles the data collection cost.
You may use named colors predefined in common/TracyColor.hpp (included by Tracy.hpp). Visual reference: wikipedia.
Tracy server will perform statistical data collection on the fly, if the macro TRACY_NO_STATISTICS is not defined. This allows extended analysis of the trace (for example, you can perform a live search for matching zones) at a small CPU processing cost and a considerable memory usage increase (at least 10 bytes per zone).